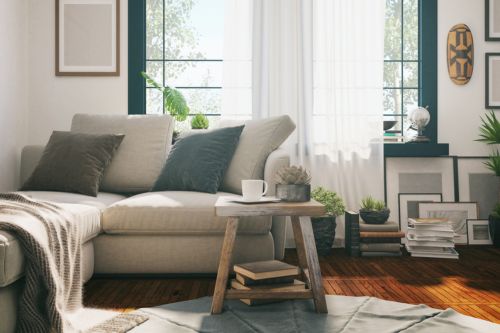
The truth is, the average size of apartments in the U.S. is shrinking, and studio and one-bedroom apartments are becoming more prevalent (rentcafe.com). This means knowing how to design for small spaces has never been more important. Whether you’re not quite ready to purchase a home or you’re looking to downsize, the creative possibilities are endless for maximizing square footage at home without sacrificing comfort or style. Let’s dive into some of the ways you can transform your home by making the most of your space.
Small Space Design Ideas
Multifunctional Furniture
All your essential items have to go somewhere, but how do you find a right place for everything without taking away from the rest of your home? Multifunctional furniture can be a lifeline for finding storage space without cluttering your home. Explore ottomans that have compartments to stow blankets, magazines, and other living room items. Folding desks can also ease the burden of storage without getting messy. Thanks to items like these, you can avoid investing in an outside storage unit just because you have limited square footage at home.
Fortunately, there’s more space available to you than the floor surface area of your home. Storage can be arranged vertically with items like hanging shelves and drawers. This can be especially helpful in the kitchen, where getting items up and away from the more cluttered areas within reach will clear counter space and make the space feel more open and inviting. Wall-mounted magnetic strips for knives and hanging racks for pots and pans can clear significant space.
When you move into a smaller space, you’ll be faced with a question: what do I really need? With only so much room available, this is the perfect opportunity for an exercise in minimalism. Paring down your possessions will reduce clutter and make the smaller spaces in your home feel roomier. Consider purchasing a bed with built-in storage drawers, which can eliminate the need for a bulky dresser in the bedroom. Get creative with floating shelves to lessen the need for large bookshelves and credenzas. Though these are common furnishings, they take up space and tend to dominate smaller rooms.
Image Source: Getty Images – Image Credit: Aleksandra Zlatkovic
With a touch of creativity, you can transform your home’s interior while maximizing your square footage, and most importantly, making your home feel more like you. For more tips on remodeling and more, visit the Living category of our blog:
The selling process is an emotional one. Fortunately, you’ll have an agent by your side from list to closing to help you take things one step at a time. A real estate agent’s expertise ranges far and wide, but as you prepare to sell your home, it helps to know that you can trust your agent to get the timing of the sale right. Let’s explore some of the ways that your agent will help you make the decision to sell your home.
We’ve all heard the adage “location, location, location” as it applies to buying a home, but it also factors into selling a home. Your location will determine your local market conditions, which, in turn, will form your approach to selling your home. Real estate agents have their finger on the pulse of market trends and property values, which gives them in-depth insight into the housing environment around you. They’ll use their access to the Multiple Listing Service (MLS) to perform a thorough Comparative Market Analysis (CMA) of your home to make sure you get the best price while factoring in your local market conditions.
Economic changes also play a role in the timing of your home sale. Mortgage rates, inflation, etc. are often in flux, and these changes can affect how buyers are approaching the market. Your agent will be able to offer insight into how the current economic conditions are influencing the housing market. For more information on this intersection between the economy and the housing market, plus up-to-date analyses of local market conditions in your area, visit the Market News section of our blog.
Best Time to Sell Your Home
Another tool in a listing agent’s toolkit is their knowledge of seasonality. Seasonal fluctuations in the housing market can influence your selling strategy, and your agent knows how these changes throughout the year affect your local housing market. For example, buying activity may dip locally in the winter. In this case, you could spend the winter getting your home ready to sell by spring by investing in high ROI home renovations and landscaping projects to improve curb appeal.
Real Estate Agent Networking
Your agent’s ability to access and analyze information will be a huge help in determining when to hit the market, but their relationships are equally important in getting your home sold to the right buyer. Real estate agents have strong connections to all the important people in the home selling process. Their network will help to facilitate the sale of your home once you’ve decided it’s the right time to sell. It takes a village to cross the finish line, and your real estate agent will help you connect with all the role players it will take to get there.
To learn more about selling your home, connect with a local Windermere Real Estate agent:
Prepping for parenthood? There are so many exciting changes on the horizon, but one change you’ll need to make at home is making sure you have a nursery all set up for your little one. As a renter, you may not have a ton of extra space to work with and you may also be limited by how many aesthetic changes you can make, but with the right guidance and a little creativity, your DIY nursery décor efforts can soar.
Nursery Preparation
Before you get into the design details, you need to choose a location for your nursery. Ideally, it will be close enough to your bedroom that you can quickly give your newborn the attention they need. To properly childproof your home, remove all unnecessary items from the nursery. Properly decluttering the area will help you prioritize safety. For more tips on childproofing your home, visit the U.S. Consumer Product Safety Commission online: Childproofing Tips – CPSC
DIY Nursery Décor
1. Creative Storage Ideas
As a renter, you’ve likely gotten practice maximizing space at home. Storage in the nursery will help to keep everything tidy while making sure that the things you and your child needs are never too far away. Floating shelves and wall-mounted organizers are two popular choices for making the most of vertical space. Be sure to check your lease and talk to your landlord before drilling into the walls to prevent permanent damage. Keep all toys, diapers, and baby-related accessories in easily reachable baskets, stored either underneath the bed or in the closet.
2. Nursery Color Palette
Let your imagination run wild with color design ideas for painting and decorating. Add splashes of colors in the window curtains, pillows, bedding, carpeting, and other accessory items throughout the room. You can also consider removable wallpaper to refresh the room. If you are decide to re-paint, use an indoor paint calculator to determine how much paint you’ll need and to cut down on wasted material.
3. Light and Dark
Finding the right lighting for your home is a room-by-room journey. The kitchen, for example, has different lighting needs than your cozy reading nook. Your nursery is a unique area when it comes to proper lighting. To create a calm atmosphere, choose soft, warm-temperature lamps with dimmers. This allows you to adjust the lighting levels to fit the time of day (or night). Less harsh light is easier on a newborn’s eyes and can make for less of a headache when you’re waking up multiple times a night. Babies also need lots of rest, so it’s important to install heavy curtains that block out sunlight and allow your little one to drift into deep sleep.
4. Bring Nature Indoors
Incorporating nature at home has aesthetic benefits, of course, but it’s also good for your health. Using organic materials, house plants, and earthy accessories can help you breathe easier and lower your stress levels at home. Consider adding small potted plants along the windowsill, installing a mobile with a touch of nature, or even incorporating a small water feature in the room to encourage serenity. A nature-infused nursery will help you relax your mind so you can take each at-home parenting step in stride. To further align your nursery’s design with the rest of your home, learn about which house plants match with different interior design styles.
5. Create a Gallery Wall
You’ll create many memories in your nursery. Who knows? It could be the room where your child takes their first steps or utters their first word. Use wall space creatively by creating a gallery wall with adhesive strips to minimize damage to the walls. You can add personal photos and keep track of special memories made with your family at home. Consider a corkboard or magnetic whiteboard to pin up new memories in sight as well.
For more info on home décor, remodeling tips and more, visit the Design category of our blog:
A lot of information comes at you during the house hunting process. As you search for a home, you’ll likely come across the term “pre-listing inspection” here and there. It can be confusing, especially if you’re buying a home for the first time. So, what is this special report and why is it only found in certain listings? Let’s take a deep dive on the pre-listing inspection, how it factors into making an offer on a home and unravel why some sellers choose to conduct it.
What is a pre-listing inspection?
A seller’s pre-listing inspection is a report issued by the seller before listing their home for sale. A professional home inspector thoroughly examines the home, checking everything from the roof, foundation, and plumbing to its heating, cooling, and electrical systems to identify any repairs that need to be made or any larger issues that need addressing. During the more developed stages of a real estate transaction, you’ll have a professional home inspector perform an inspection to make sure you’re buying the home as advertised. With a pre-listing inspection, the seller is pre-empting this process.
Pre-Listing Inspection Benefits
There are three main reasons why sellers conduct a pre-listing inspection: transparency, repairs, and pricing. It also helps to streamline the buying/selling process, especially in highly competitive markets. In these market conditions, it’s also more common for buyers to waive the inspection to sweeten their offer and get a leg up on the competition. Talk to your agent for more information.
By providing buyers with a clear picture of the home’s condition upfront, sellers are putting their cards on the table. This transparency helps to build trust with buyers interested in their home.
It’s also a way for sellers to identify outstanding repairs and make them before their home goes on the market. The seller can proceed through the selling process with a clear mind knowing they’ve already addressed the issues they found early on. Then, when it’s time for the buyer’s inspection, you can compare the results to make sure you have a full understanding of the home’s condition.
The findings of a pre-listing inspection also help to solidify the asking price the seller eventually sets; they either reaffirm its condition or show the areas where it’s lacking or needs attention. After you make an offer, the bank will order an appraisal of the property to make sure you’re paying a fair price.
For you, walking into the buying process with a pre-listing inspection in hand means you have intimate knowledge of the home’s condition right from the beginning, which will inform your strategy for making an offer. If the seller invested heavily in repairs, they may be less likely to budge on price. If there are several outstanding issues, that may be a negotiation opportunity for you and your agent.
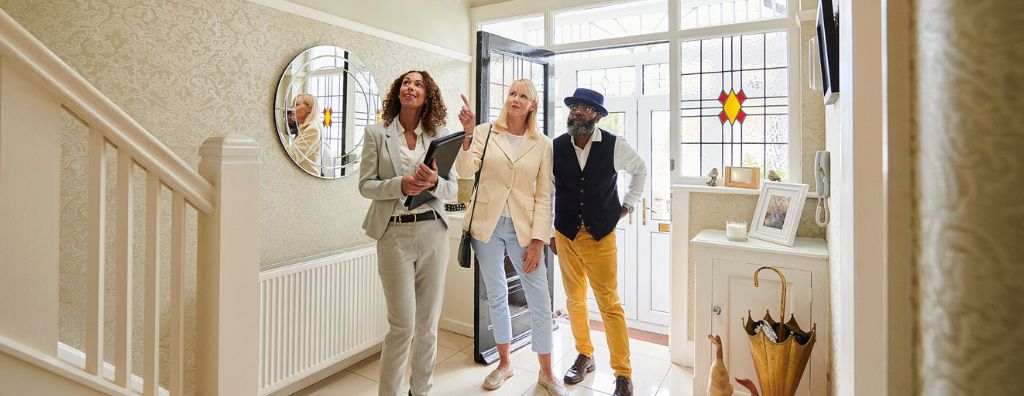
Image Source: Getty Images – Image Credit: sturti
Who pays for home inspection?
The seller pays for the pre-listing inspection. You’ll want to conduct your own to see whether there are any discrepancies between the two. Even professional inspectors can miss something, so it’s worth it to double check their work. This inspection is just one of the costs of the home buying process, but it can save you from the significant costs of undetected repairs down the road. Besides, even in the short amount of time between the pre-listing inspection and when you make your offer, it’s entirely possible that something regarding the home’s condition changed. Getting your own inspection is crucial to gaining a crystal-clear understanding of the home before purchase.
So, should you trust a seller’s pre-listing inspection? Yes, but approach with caution. It shouldn’t necessarily be the final authority on the home’s condition, but it is mutually beneficial for both parties and allows you to make a better-informed decision on whether you want to move forward with your offer. Talk to your agent for guidance on how to navigate the home inspection process. For more information, visit our comprehensive guide to buying a home:
The following analysis of select counties of the Western Washington real estate market is provided by Windermere Real Estate Chief Economist Matthew Gardner. We hope that this information may assist you with making better-informed real estate decisions. For further information about the housing market in your area, please don’t hesitate to contact your Windermere Real Estate agent.
Regional Economic Overview
As discussed in the first quarter Gardner Report, job growth continues to slow. Even though Western Washington added 54,391 new jobs over the past 12 months, which represented a decent growth rate of 2.3%, the slowdown in the creation of new jobs is palpable. The regional unemployment rate in May was 3.7%, which is marginally above the 3.4% of a year ago. As we enter the summer months, I have started to ponder the economic outlook for the balance of this year as well as looking ahead to 2024. Although many are still suggesting a looming recession, I remain unconvinced. However, if enough people expect to see an economic contraction, it can become a self-fulfilling prophecy, which has happened in the past!
Western Washington Home Sales
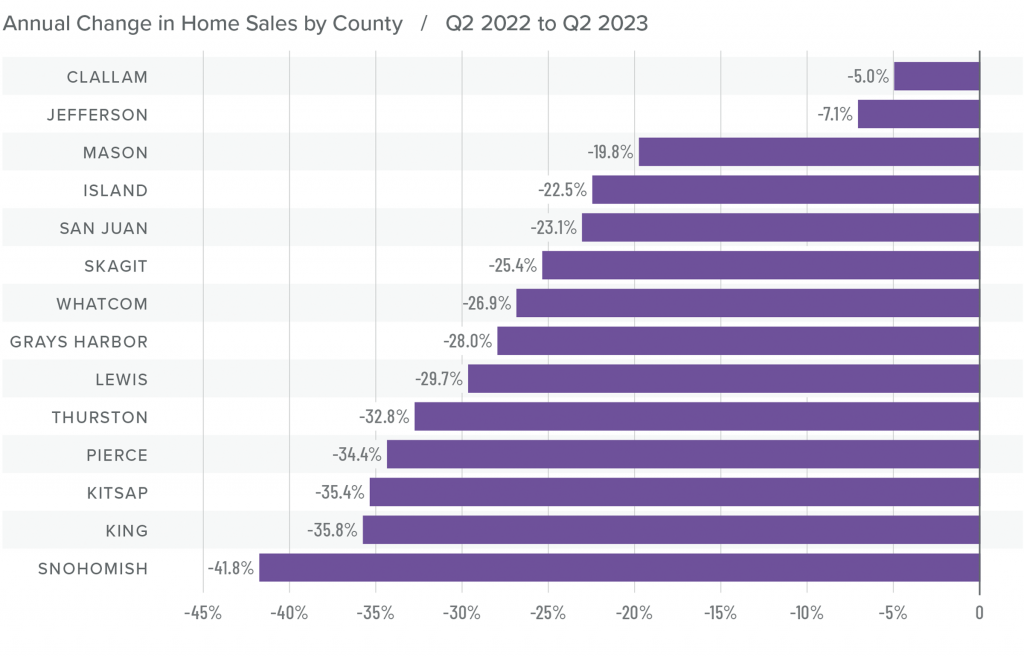
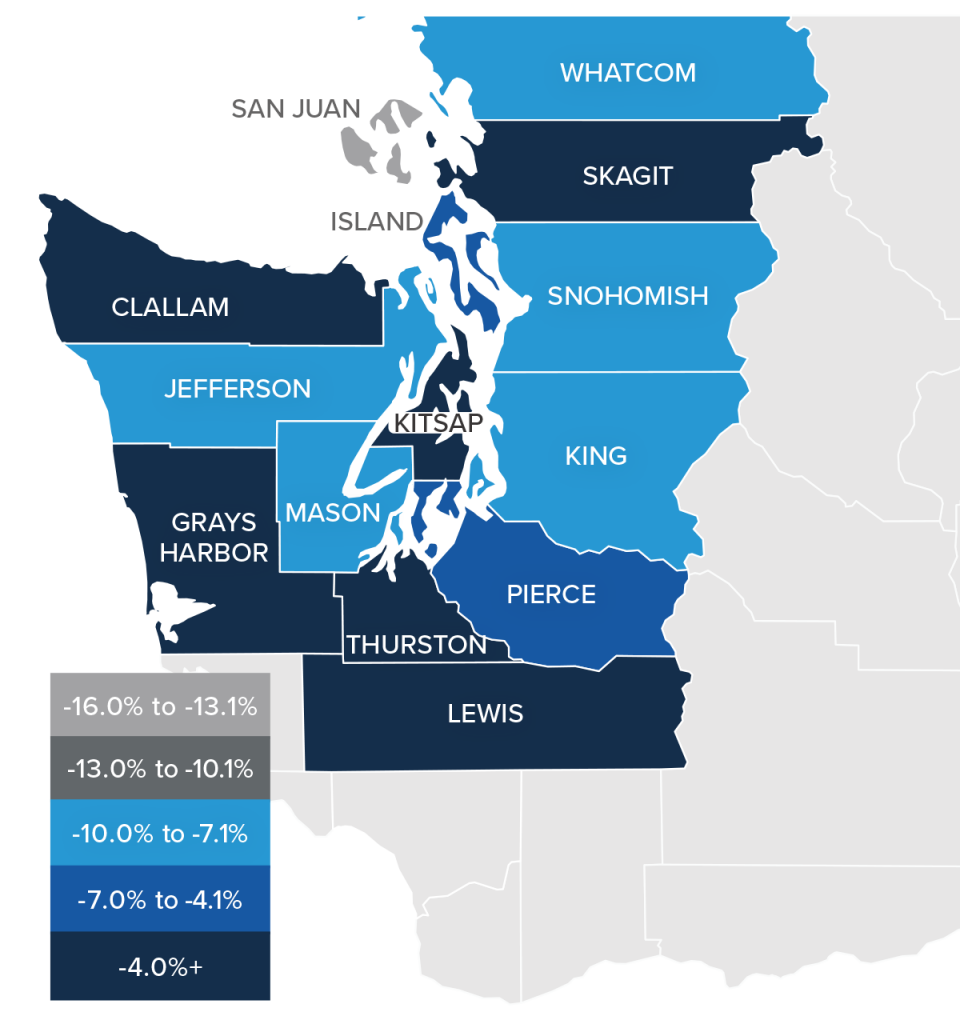
❱ In the second quarter of 2023, 14,997 homes sold. This was down 34.4% from the second quarter of 2022, but up 43.8% from the first quarter of 2023.
❱ The growth in quarter-over-quarter sales was due to the 21.7% increase in the number of homes for sale. While this is positive, it should be noted that inventory levels in the quarter were still 16% lower than a year ago.
❱ Sales fell across the board compared to the same quarter in 2022 but were up in all markets compared to the first quarter of 2023.
❱ Pending sales rose in all counties compared to the first quarter of this year, suggesting that sales in the upcoming quarter may show further improvement.
Western Washington Home Prices
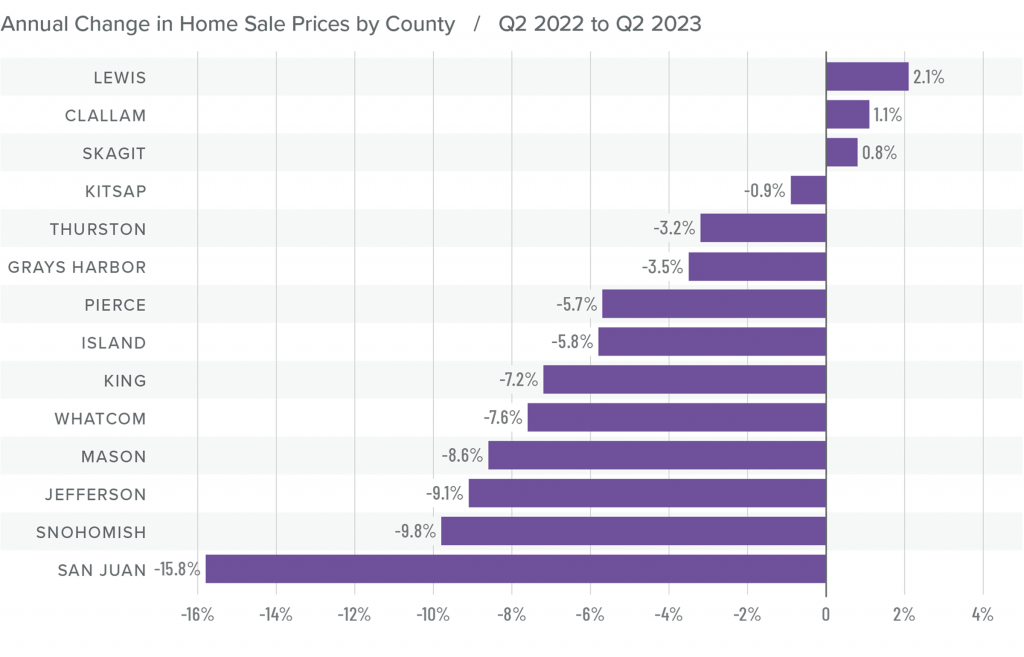
❱ Sale prices fell an average of 7.6% compared to the second quarter of 2022 but were 11.7% higher than in the first quarter of this year. The average home sale price was $773,343.
❱ Compared to the first quarter of this year, sale prices were higher in all counties except San Juan, which, as a small island county, is notorious for its extreme price swings.
❱ The year-over-year drop in sale prices was not a surprise given that the market was peaking due to rapidly rising mortgage rates. That said, prices in Lewis, Clallam, and Skagit counties exceeded those of a year ago.
❱ It was interesting to see list prices rising in all markets compared to the first quarter of the year. Even though inventory levels have risen, sellers still believe that they are in the driver’s seat.
Mortgage Rates
Although they were less erratic than the first quarter, mortgage rates unfortunately trended higher and ended the quarter above 7%. This was due to the short debt ceiling impasse, as well as several economic datasets that suggested the U.S. economy was not slowing at the speed required by the Federal Reserve.
While the June employment report showed fewer jobs created than earlier in the year, as well as downward revisions to prior gains, inflation has not sufficiently slowed. Until it does, rates cannot start to trend consistently lower. With the economy not slowing as fast as expected, I have adjusted my forecast: Rates will hold at current levels in third quarter and then start to trend lower through the fall. Although there are sure to be occasional spikes, my model now shows the 30-year fixed rate breaking below 6% next spring.
Western Washington Days on Market
❱ It took an average of 35 days for homes to sell in the second quarter. This was 20 more days than in the same quarter of 2022, but 21 fewer days compared to the first quarter of this year.
❱ Snohomish County became the tightest market in Western Washington, with homes taking an average of only 18 days to sell. Homes for sale in San Juan County took the longest time to sell at 81 days.
❱ All counties contained in this report saw average days on market rise from the same period in 2022. Market time fell across the board compared to the prior quarter.
❱ The greatest fall in days on market compared to the first quarter was in Clallam County, where market time fell 31 days. Also of note were Pierce, Thurston, and Whatcom counties, where market time fell 25 days.
Conclusions
This speedometer reflects the state of the region’s real estate market using housing inventory, price gains, home sales, interest rates, and larger economic factors.
The increase in listing activity, while pleasing, still leaves the market short of inventory. Even with mortgage rates well above levels we’ve seen over the past few years, demand for homes still exceeds supply. Given that over 86% of homeowners with mortgages have an interest rate below 5% and more than a quarter have a rate at or below 3%, I see little incentive for them to sell if they don’t have to. This tells me that supply levels are unlikely to improve enough to meet demand until rates drop significantly.
With this supply-demand imbalance, it’s no surprise that prices are rising again following the decline in the second half of 2022. I expect prices to rise modestly as we move through the second half of 2023. Rising list and sale prices, shorter time on market, and higher pending and closed sales all offset higher mortgage rates. Given these factors, I have moved the needle in favor of sellers.
About Matthew Gardner
As Chief Economist for Windermere Real Estate, Matthew Gardner is responsible for analyzing and interpreting economic data and its impact on the real estate market on both a local and national level. Matthew has over 30 years of professional experience both in the U.S. and U.K.
In addition to his day-to-day responsibilities, Matthew sits on the Washington State Governors Council of Economic Advisors; chairs the Board of Trustees at the Washington Center for Real Estate Research at the University of Washington; and is an Advisory Board Member at the Runstad Center for Real Estate Studies at the University of Washington where he also lectures in real estate economics.
There’s nothing more exciting, rewarding, and fulfilling than buying or selling a home. However, it’s a complex transaction, and there are a number of steps along the path that can confuse even the most seasoned buyers and sellers. How can you avoid potential selling pitfalls and common buying mistakes? Look to your real estate agent for advice and keep the following guidelines in mind.
How to Avoid Common Mistakes in Real Estate
Common Buying Mistakes
#1 Review Your Credit Reports Ahead of Time
Review your credit report a few months before you begin searching for homes. You’ll have time to ensure the facts are correct and be able to dispute mistakes before your mortgage lender checks your credit. Get a copy of your credit report from Experian, Equifax, and TransUnion. Why all three? Because, if the scores differ, the bank will typically use the lowest one. Alert the credit bureaus if you see any mistakes, fix any problems you discover, and don’t apply for any new credit until after your home loan closes.
Before getting serious about your hunt for a new house, you’ll want to choose a lender and get pre-approved for a mortgage (not just pre-qualified—which is a cursory review of your finances—but pre-approved for a loan of a specific amount). Pre-approval lets sellers know you’re serious. Most importantly, pre-approval will help you determine exactly how much you can comfortably afford to spend.
#3 Know What You Want
You and your real estate agent should both be clear about the house you want to buy. Put it in writing. First, make a list of all the features and amenities you really want. Then, number each item and prioritize them. Now, divide the list into must-haves and nice-to-haves.
#4 Account for Hidden Costs
In addition to the purchase price of the home, there are additional costs you need to take into consideration, such as closing costs, appraisal fees, and escrow fees. Once you find a prospective home, you’ll want to:
Get estimates for any repairs or remodeling it may need
Estimate how much it will cost to maintain (gas, electric, utilities, etc.)
Determine how much you’ll pay in taxes monthly and/or annually.
Buying a home is emotionally charged—which can make it difficult for buyers to see the house for what it truly is. That’s why you need impartial third parties who can help you logically analyze the condition of the property. Your agent is there to advise you, but you also need a home inspector to assess any hidden flaws, structural damage, or faulty systems.
Once you decide to sell your house, it’s time to strip out the emotion and look at it as a commodity in a business transaction. If you start reminiscing about all the good times you had and the hard work you invested, it will only make it that much harder to successfully price, prepare, and market the home.
Homes with deferred maintenance and repair issues can take far longer to sell and can be subject to last-minute sale-cancellations. These homes also often sell for less than their legitimate market value. If you simply can’t afford to address critical issues, be prepared to work with your agent to price and market your home accordingly.
#3 Don’t Overprice Your Home
Getting top dollar is the dream of every seller. But it’s essential that you let the market dictate that price, not your emotions or financial situation. Allow your agent to research and prepare a market analysis that factors in the value of similar homes in the area and trust those results. Overpricing your home often spells trouble and can leave significant money on the table.
#4 Use Quality Photos
The vast majority of prospective buyers today search for homes online first. In order to make a good first impression, you need a wealth of high-quality photos of your home and surrounding grounds. It’s also critical that you stage your home to generate maximum buyer interest.
The process of buying or selling a home can have plenty of twists and turns, but with some smart decision making, you can avoid the most common mistakes and pitfalls. Lean on your agent for guidance throughout the process. Connect with a local Windermere agent to begin your buying or selling journey:
Wildfires cause chaos for homeowners. Though they are destructive, with the right preparation, you can ensure that you and your household have a plan in case of an emergency. Many homeowners insurance policies cover damage caused by wildfires, but check with your insurance agent to make sure. The following tips are meant to inform your household’s wildfire evacuation protocol, whatever your evacuation timeline may be.
Wildfire Preparation: Immediate Evacuation
Evacuation orders come from local law enforcement agencies, but if you have not received an official evacuation notice and feel threatened by wildfires in your area, do not hesitate to leave. Take only essential vehicles on the road, this will minimize traffic and reduce the chance of gridlock when evacuating the area. Keep the windows rolled up to avoid inhaling smoke and tune into local radio for updates as you head toward safer ground. Don’t forget your masks and remember to bring the six P’s:
It helps to have a “go bag” or portable kit packed ahead of time if and when a wildfire breaks out. In it, you’ll want to keep a list of essential items in case you’re away from your home for a while. Include the following items in your go bag:
Face masks or coverings
Extra clothing
First aid kit
Toiletries
Tools
Flashlight
Batteries
Sanitation supplies
Copies of important documents
Three-day supply of food and water
Wildfire Evacuation Preparation
If you live in an area that is not being evacuated, there are steps you can take now to prepare your home and family, if and when the time comes. These tasks can help to discourage fires from spreading closer to your home and hopefully salvage some household items.
Create a “defensible space” by clearing your home’s surroundings of brush and vegetation
Turn off sprinklers and main gas lines
Clean out roof and gutters
Move furniture away from windows toward the center of the room
Remove flammable household items
Prepare your emergency kit
Include essential items listed above
For more information about wildfires and indoor air quality, visit the Environmental Protection Agency (EPA) website. Be sure to check your local news and emergency alert radio stations and social media profiles for the most up-to-date information and helpful resources.
Wildfires are unpredictable. Knowing what to do both in preparation for and during an emergency evacuation will have your household prepared in the event that a wildfire spreads to your area, neighborhood, or home.
Sold for: $750,000 (Sold for 15.4% over asking) Listed For: $650,000
Beds: 3
Baths: 3
Size: 1,620 sqft
Stunning MidCenturyModern daylite rambler in exceptional private setting. Custom designed/built one-owner home, enchanting woodland lot, refined spaces w/top quality MCM finishes in pristine condition. Great floor plan! Formal liv rm, updated quartz & tile kitch w/family rm, 3 firplc, lots of windows & glass doors open to light, sky & the great outdoors, views from every room. Big deck for entertaining, updated privt bath off Primary bedrm. Walk-out basmt is a clear slate for finishing your way: 4th bath plumbed, more bedrms, recrm, etc. Huge workshop w/sep entry is already there. All this space, peace & quiet just min. to freeways, shops, Kent Station, SeaTac Airport, & more. A rare chance to own a uniquely personal, distinctive estate.
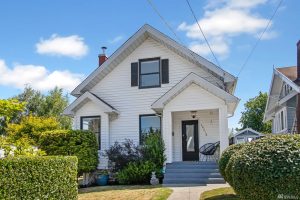
2302 Blaine Avenue NE Renton, WA 98056
Sold for: $590,000 (Sold for 50.9% over asking) Listed For: $390,980
Beds: 2
Baths: 1
Size: 790 sqft
Great opportunity to cinch a place in Renton’s cherished Kennydale neighborhood! Solid house built to modern construction standards is ready for new owner to take it to the next level. All the elements are here; refreshed attention, talent and energy will be rewarded with longterm benefits of homeownership in a superb Location, Location, Location! Easy one-level living for beginners or “right-sizers,” abundance of interesting architectural design features:soaring cathedral ceilings, well-designed room layouts, plenty of natural light. Oversized lot with mature flowering shrubs and roses is an inviting “Clear Canvas” for your creative landscaping plans. Minutes away fr 405, silly-easy access to all the best compass points for work and play.
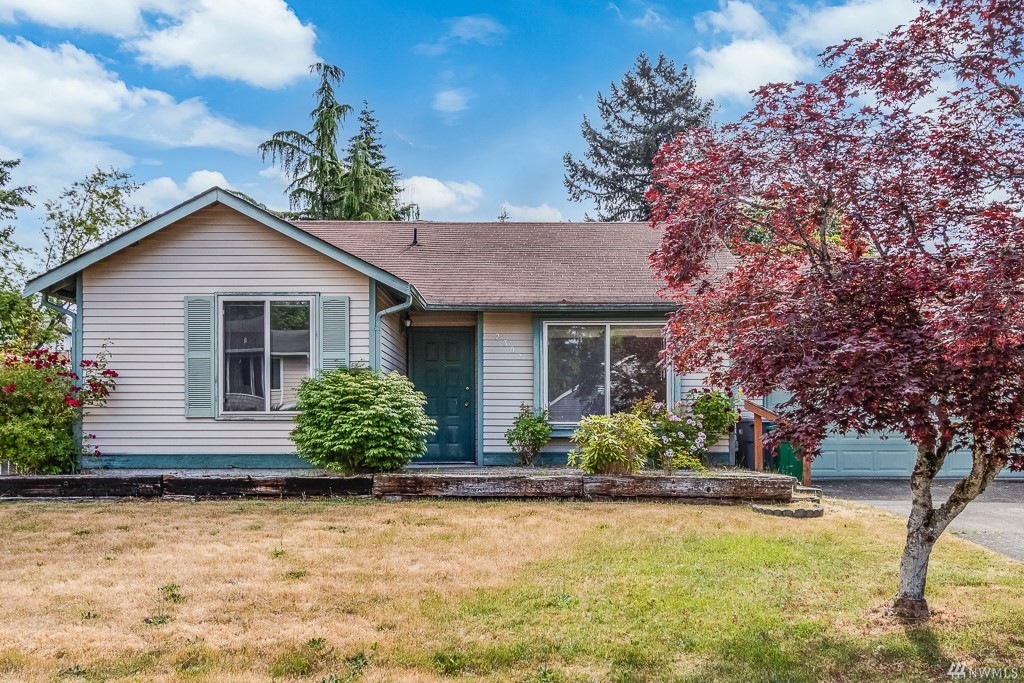
10125 SE 207th Street Kent, WA 98031 Sold for $150,000
Lot Size Area: 17,778.00 sqft
Water Source: Available
Sewer: Available
Fantastic opportunity to build your dream home in a private, peaceful location just minutes from every point on your live/work/play compass. 17,778 sq ft lot. Plenty of privacy! Create a forever-after magical estate you will enjoy for years to come. No HOA. Water, sewer in the street. No surveys or studies have ever been conducted. Buyer to do all feasibility investigations to their own satisfaction.
Everyone’s darling! Early 1900’s Cape Cod Craftsman all pin-tight and ready for new owners. Cheek-pinching-cute with covered porch entry, rich fir flrs, box-beamed ceilings, crown molding, orig doors & trim, window seats, firplc, forml dining, full natural light. Updated kitch has timeless subway tile, gas cooking, bulter’s pantry. Both bedrooms have multiple closets plus built-in storage, office has knock-out views of Lake Washington, mountains, Seward Park and Mercer Island. Basmt is ready to finish. H.U.G.E fenced/ pet-friendly lot has endless possibilities: Gardening, urban farming, lawn parties, future DADU(s)? Garage/shop for serious hobbies. Ideal location close to light rail, I-5, Upper Rainier Beach amenities, etc. Lots of ways to expand/add value!
Information provided as a courtesy only, buyer to verify. For more, go here.
Good news! Selling a home is not a solo endeavor. Your goal in selling your home is to get the best price in a timeframe that meets your needs. To do that, you’ll enlist a team of professionals. So, who are the parties involved in a real estate transaction? Let’s review ten important people in the home selling process so you can be prepared once you’re ready to sell your home. And to understand the process from the buyer’s side, check out 10 Important People in the Home Buying Process.
10 Important People in the Home Selling Process
1. Real Estate Agent
We’re starting this list with your real estate agent for a reason. The agent representing you is known as a listing agent, and they will be your personal MVP of the selling process. Not only will they conduct a Comparative Market Analysis (CMA) to set a competitive price for your home, but they also know how to market it effectively, they’ll negotiate on your behalf, and they’ll guide you through the process of finalizing the transaction. When searching for an agent, find someone whose professionalism you respect, someone who knows the local market, and most importantly, someone who cares about your goals.
2. Remodeling Contractors
Having your home in tip-top shape when you sell will help you boost its value and get the best price. If you’re thinking about selling, it’s a great time to complete remodeling projects that will help your home stand out amongst the competition. Yes, you have a significant pay day coming when you sell your home, but you want to focus your attention on high ROI remodeling projects that will get you the most bang for your buck. Talk to your agent about which home renovations are drawing buyer interest and strategize accordingly.
3. Home Inspector
Another important aspect of preparing your home for sale is being aware of what repairs it needs, which is why some sellers conduct a pre-listing inspection. Getting the information in this report before you hit the market will help you schedule repairs quickly and shows buyers a level of transparency that informs their buying process. Even if you don’t get a pre-listing inspection, a home inspector will enter the fold eventually. But hiring your own professional early on will give you a better understanding of your property’s condition.
4. Home Staging & Real Estate Photographer
We’re combining a couple professionals in real estate marketing here, but both are critical to successfully selling your home. Home staging can boost home value and helps buyers more easily imagine themselves living somewhere new. And in today’s world, it’s more important than ever to represent your home well online. High quality real estate photos maximize your home’s appeal and differentiate it from other listings. Both a professional home stager and real estate photographer will help you attract buyer interest. And for the do-it-yourself crowd, consider our 7 Tips for Staging Your Home Yourself.
5. The Right Buyer
We’d be remiss if we didn’t mention the party on the other side of the transaction—the buyer! To find the right offer, it’s important that you communicate with your agent regarding your goals. There are multiple layers to a buyer’s offer beyond the price, so the better your agent understands what meets your needs, the quicker they can identify it and the better they can negotiate on your behalf. For more, read How to Negotiate as a Seller.
Whereas a buyer’s agent helps them find and make an offer on your home, their mortgage broker assists them in securing substantial financing to actually purchase it. Once the buyer gets approved for a loan, their mortgage lender takes over the home financing process. Buyers may choose to work directly with a mortgage lender.
7. Home Appraiser
During the process of selling your home, the buyer’s lender will hire a professional appraiser to evaluate your home’s location, size, and condition along with recent sales of comparable listings to determine its appraised value. This is to ensure that the buyer isn’t overpaying for the property and that you’re not underselling it. Knowing the difference between appraised value and market value will help you understand how a home’s eventual sales price comes to be.
8. Title Company
A home sale isn’t official until ownership has been transferred from the seller to the buyer. To do this, you’ll meet with a title officer during the closing process to sign paperwork and transfer the deed. The title company will conduct a search of the property’s records to make sure it’s in good legal standing and is fit to sell.
9. Escrow Company
So, how does the buyer’s money actually make its way to you? That’s where escrow comes in. Escrow in real estate is a third-party company responsible for holding the funds while the deal is in motion and disbursing them once it goes through. Though you may not meet the person responsible for routing the money for your home sale, they’re a key part of the closing process.
10. Moving Company
Congratulations, you’ve sold your home! Whether it’s arranging utility service or updating your banking information, there are a thousand little things to do during this exciting time. Keep track of your moving timeline with our comprehensive Moving Checklist.
Thinking about selling your home? Start by finding the right agent, one of the most important people in the home selling process. Connect with a local Windermere agent to get answers to all your questions from list to closing.

 Facebook
 X
X
 Pinterest
 Copy Link


 Mortgage Rates
 This speedometer reflects the state of the region’s real estate market using housing inventory, price gains, home sales, interest rates, and larger economic factors.
 About Matthew Gardner


 10115 SE 207th Street
  2302 Blaine Avenue NE
  10125 SE 207th Street
 10216 56th Avenue S.