Just like December temperature variations, our local real estate market continues to feel up and down. Interest rates, regional economic conditions and seasonal market shifts have meant rising home prices in some areas and drops in others. While the expected winter slowdown means overall lower inventory, buyers are still willing to compete for plum properties in a diminishing pool of available listings.
A slight decrease in interest rates has raised cautious optimism in our region. Interest rates fell to around 7.2% as of December 1, compared to 7.8% in October. A continued trend in this direction could signal some welcome positivity in the market as we move into the new year.
In King County, the expected decline in winter inventory is pushing up year-end home prices. The region saw a 7% year-over-year increase in the median residential sold price, from $827,000 in November 2022 to $885,500 last month. Buyers are still showing up: there’s steady demand and potential competition for each available home that’s in good condition and well-priced. King County condos also saw a year-over-year price increase, with the median sold price up 4% in November to $485,000.
Seattle saw a 5% increase in the median sold price of a single-family home, up from October’s $900,000 to $944,000 last month. The market kept some momentum in November, with 48% of Seattle homes selling at or above asking price and 79% going under contract in 30 days or less. Condo prices saw a 21% year-over-year jump, from $480,500 in November 2022 to $582,750 last month. This price growth flew in the face of significant supply, at 3.4 months of inventory.
The Eastside median residential sold price experienced a modest decline in November, down 1% from October’s $1,420,000 to $1,400,000 last month. However, the November price was still up 6% from November 2022, while 75% of sold listings went under contract in 30 days or less. Residential inventory remained fairly flat on the Eastside, increasing slightly from 1.5 months in October to 1.6 months in November. Eastside condo prices increased last month, with a median sold price of $620,000, up from $569,500 in November 2022.
Snohomish County saw a year-over-year bump in prices last month. The median sold price for a single-family home rose from $700,000 last November to $725,000 this November. Supply stood at just 1.3 months at the end of the month, down 32% from this time last year. Condo prices also rose, from $507,500 in November 2022 to $521,209 last month.
As winter unfolds, it’s crucial for buyers and sellers to work with a knowledgeable broker to navigate this churning real estate market. Together you can create a strategy that best supports your real estate goals for the new year.
This video shows Windermere Chief Economist Matthew Gardner’s Top 10 Predictions for 2024. Each month, he analyzes the most up-to-date U.S. housing data to keep you well-informed about what’s going on in the real estate market. See more market insights on our blog here.
Matthew Gardner’s Top 10 Predictions for 2024
1. Still no housing bubble
This was number one on my list last year and, so far, my forecast was spot on. The reason why I’m calling it out again is because the market performed better in 2023 than I expected. Continued price growth, combined with significantly higher mortgage rates, might suggest to some that the market will implode in 2024, but I find this implausible.
2. Mortgage rates will drop, but not quickly
The U.S. economy has been remarkably resilient, which has led the Federal Reserve to indicate that they will keep mortgage rates higher for longer to tame inflation. But data shows inflation and the broader economy are starting to slow, which should allow mortgage rates to ease in 2024. That said, I think rates will only fall to around 6% by the end of the year.
3. Listing activity will rise modestly
Although I expect a modest increase in listing activity in 2024, many homeowners will be hesitant to sell and lose their current mortgage rate. The latest data shows 80% of mortgaged homeowners in the U.S. have rates at or below 5%. Although they may not be inclined to sell right now, when rates fall to within 1.5% of their current rate, some will be motivated to move.
4.Home prices will rise, but not much
While many forecasters said home prices would fall in 2023, that was not the case, as the lack of inventory propped up home values. Given that it’s unlikely that there will be a significant increase in the number of homes for sale, I don’t expect prices to drop in 2024. However, growth will be a very modest 1%, which is the lowest pace seen for many years, but growth all the same.
5. Home values in markets that crashed will recover
During the pandemic there were a number of more affordable markets across the country that experienced significant price increases, followed by price declines post-pandemic. I expected home prices in those areas to take longer to recover than the rest of the nation, but I’m surprised by how quickly they have started to grow, with most markets having either matched their historic highs or getting close to it – even in the face of very high borrowing costs. In 2024, I expect prices to match or exceed their 2022 highs in the vast majority of metro areas across the country.
6. New construction will gain market share
Although new construction remains tepid, builders are benefiting from the lack of supply in the resale market and are taking a greater share of listings. While this might sound like a positive for builders, it’s coming at a cost through lower list prices and increased incentives such as mortgage rate buy downs. Although material costs have softened, it will remain very hard for builders to deliver enough housing to meet the demand.
7. Housing affordability will get worse
With home prices continuing to rise and the pace of borrowing costs far exceeding income growth, affordability will likely erode further in 2024. For affordability to improve, it would require either a significant drop in home values, a significant drop in mortgage rates, a significant increase in household incomes, or some combination of the three. But I’m afraid this is very unlikely. First-time home buyers will be the hardest hit by this continued lack of affordable housing.
8. Government needs to continue taking housing seriously
The government has started to take housing and affordability more seriously, with several states already having adopted new land use policies aimed at releasing developable land. In 2024, I hope cities and counties will continue to ease their restrictive land use policies. I also hope they’ll continue to streamline the permitting process and reduce the fees that are charged to builders, as these costs are passed directly onto the home buyer, which further impacts affordability.
9. Foreclosure activity won’t impact the market
Many expected that the end of forbearance would bring a veritable tsunami of homes to market, but that didn’t happen. At its peak, almost 1-in-10 homes in America were in the program, but that has fallen to below 1%. That said, foreclosure starts have picked up, but still remain well below pre-pandemic levels. Look for delinquency levels to continue rising in 2024, but they will only be returning to the long-term average and are not a cause for concern.
10. Sales will rise but remain the lowest in 15 years
2023 will likely be remembered as the year when home sales were the lowest since the housing bubble burst in 2008. I expect the number of homes for sale to improve modestly in 2024 which, combined with mortgage rates trending lower, should result in about 4.4 million home sales. Ultimately though, demand exceeding supply will mean that sellers will still have the upper hand.
About Matthew Gardner
As Chief Economist for Windermere Real Estate, Matthew Gardner is responsible for analyzing and interpreting economic data and its impact on the real estate market on both a local and national level. Matthew has over 30 years of professional experience both in the U.S. and U.K.
In addition to his day-to-day responsibilities, Matthew sits on the Washington State Governors Council of Economic Advisors; chairs the Board of Trustees at the Washington Center for Real Estate Research at the University of Washington; and is an Advisory Board Member at the Runstad Center for Real Estate Studies at the University of Washington where he also lectures in real estate economics.
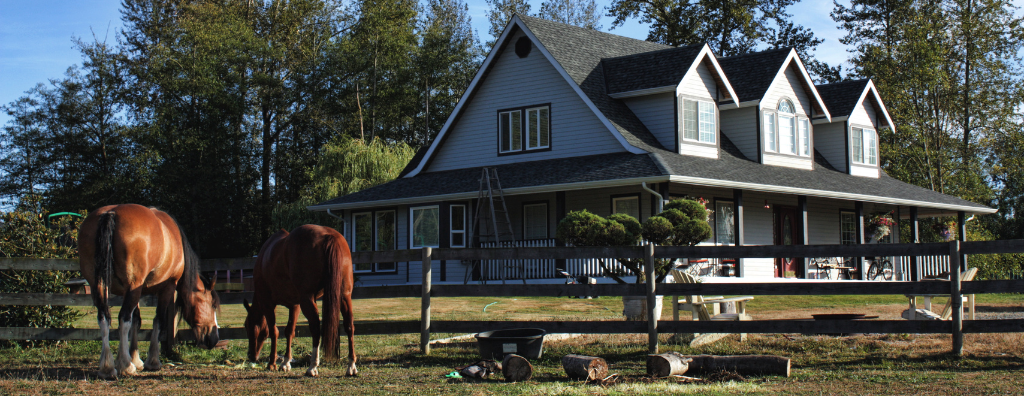
For equestrian homeowners who are thinking about selling, there’s a long list of to-dos to get to. Not only do you need to spruce up the home itself, but your surrounding property should be in prime condition as well. To maximize your return on investment and drive buyer interest, consider making strategic upgrades that enhance both your home and your land. Improvements like these will add value to your home and cater to the equestrian enthusiasts.
Boost Equestrian Property Value
Equestrian Facilities
What truly matters to equestrian buyers? Their horses. Knowing that their horses have access to high-quality facilities will be the key to attracting serious buyers. Focus your upgrading efforts on the stables and barns. Proper ventilation, spacious stalls, and easy access to the surrounding pastures on the property.
Buyers also want to know that their horses will be safe, so secure fencing is a must. Consider investing in durable fencing materials like vinyl, wood, or pipe fencing depending on the area that needs fixing and/or upgrading. Make sure all paddocks are fenced off appropriately. This is certainly a factor equestrian buyers will consider as they compare your property to other listings.
Depending on what discipline you’ve trained on your property, your riding arena will have different footing. Talk to an equestrian real estate specialist about best practices for upgrading and cleaning up your arena as you prepare to sell, they’ll be aware of any recent buyer trends and patterns you might want to lean into. What’s most important is that your riding arena look professional and clean, ready for buyers who are looking to train or compete.
Maintaining an equestrian property is more time consuming than caring for a typical single-family home, but as you prepare to sell, your land maintenance will kick into high gear. Well-kept landscaping will not only increase your home value, but it will also provide a safe environment for the eventual buyer’s horses. This is especially important if your property has scenic trails; landscaping features like these are a selling point and should be treated with care accordingly.
Home Improvements
The typical high ROI remodeling projects like upgrading your bathrooms, bedrooms, and kitchen apply for equestrian homeowners as well, but there are certain equestrian-specific upgrades that will apply uniquely to home buyers with horses. A remodeled mudroom or tack room will help you differentiate your listing, as will sustainable upgrades like solar panels or renewable energy capabilities throughout the property. Sustainability continues to grow in importance for homeowners of all types, equestrian included. Now more than ever buyers are mindful of ways they can sustainably manage their property. If you invest in eco-friendly improvements, your property could appeal to a wider pool of buyers.
By making upgrades like these, you’ll present your equestrian property in the best light, and you’ll significantly increase your chances of engaging buyers who are willing to pay a premium. For more information on how to prepare your property for sale, connect with an experienced equestrian advisor:
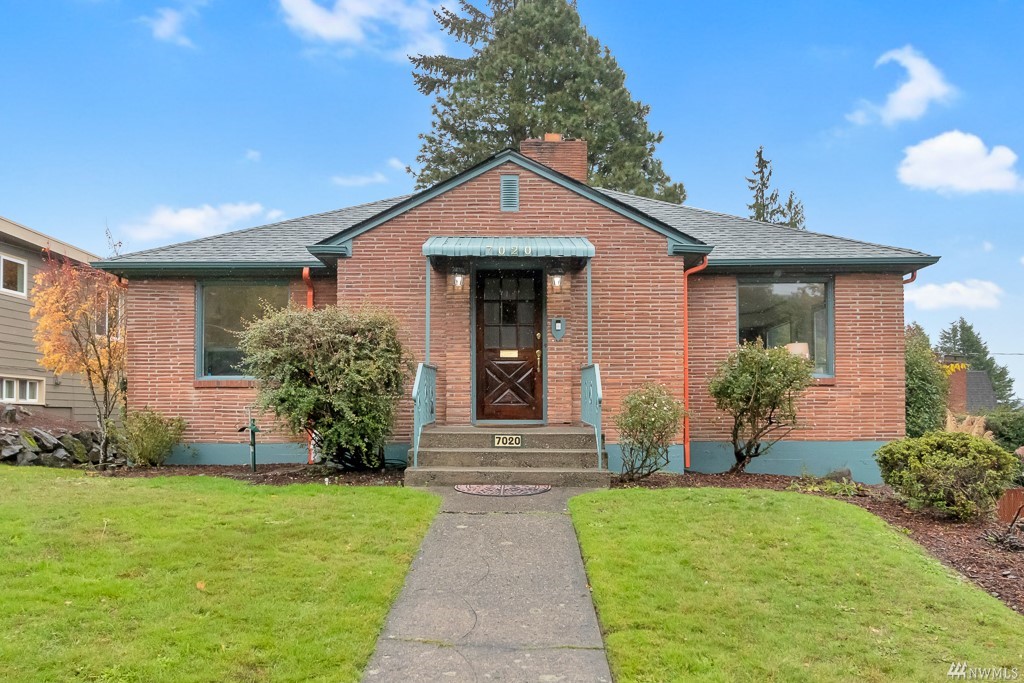
7020 Seward Park Avenue S Seattle, WA 98118 $798,000
MLS #2177496
CLIP #5961798802
Beds: 3
Baths: 2
Size: 2,170 sqft
Days on OneHome: 7
Romantic brick bungalow in Seward Park is loaded with artful spaces for comfortable living. Rich and elegant doors/millwork, honey-colored hardwoods, coved ceilings, crown molding, soft curves and arches, vintage fixtures, so many unique custom finishes. Art-deco living rm firplc owns center-stage, pretty built-ins create a formal dining space for entertaining, sunny retro kitchen is the favorite hub for catching up and hanging out. Full basement has recroom, second fireplace, bath, space for more bedrooms/home office, endless possibilities. 7200+ sqft. Lot for gardening or future ADU. New paint in and out, new roof, sewer all 10/2023, easy off-street parking for you and guests. Walk to Martha Washington Park and beaches, short hop to Seward Park and local shops.
18606 48th Place South SeaTac, WA 98188 $448,950
MLS #2176023
CLIP #8410220529
Beds: 2
Baths: 3
Size: 1,400 sqft
Days on OneHome: 14
Move-in ready townhome in amazing location with superb access to everything that can help you play more, work less! Quiet village atmosphere of only 24 homes is just min. to I-5, I-405, SeaTac Airport, Southcenter, two Light Rail stations for easy travel to downtown Seattle, sports stadiums and beyond. Extraordinary light from multiple skylights and west-facing windows, vaulted ceilings and lofted alcoves, generous room sizes; volumes of light, airy spaces that include plenty of privacy inside and out. 2bed/2.5bth/plus 2 home-office or hobby spaces, Primary bedroom with balcony and private bath. Freshly painted, new carpeting and vinyl, one attached and one detached garage, fenced backyard. Friendly HOA, low dues-$277/month! NOT a condo. Unbeatable value.
As the end of the year approaches, I find myself thinking about all that I have to be thankful
for — good friends, family, our health, home and garden, and of course, our two fur babies,
Dylan and Dexter.
I’m also grateful for your business, referrals and support over the years. Without it, and the
support of the Northwest’s best real estate professionals, I wouldn’t have been able to help 24
families achieve their life goals this year.
Thank you! I hope the season finds you feeling blessed as well.
Despite the tendency to daydream about moving to a remote destination during the pandemic, new data reveals that a record percentage of Washington residents are choosing to stay where they are. This echoes a national trend, which indicates that between 2019 and 2022, the number of Americans who lived in the same house year over year increased by eight million.
This trend is more pronounced in Washington than in most states. In 2022, approximately 6.57 million Washingtonians – or 85% of the state’s population – lived in the same home that they occupied a year earlier. That’s up from a pre-pandemic rate of 83% staying in the same house between 2018 and 2019.
Moreover, the data shows that the number of people who made even a short-distance move (within the same county) dropped significantly. In 2019, approximately 750,000 Washington homeowners made a nearby move, whereas in 2022 that number fell by 24% to 605,000 homeowners deciding on a local change of address.
Why the tendency to stay put? The pandemic may have spurred the trend locally and nationally. As a point of reference, the Census Bureau’s Current Population Survey in 2000 showed that only about 76% of Washington residents were living in the same house as the year prior.
Age may be a factor, as well. The tendency to move more often has historically been a younger-adult behavior. The median age in the US was up to 39 in 2022, as opposed to 35 in 2000, suggesting that an aging population is less inclined to go through the upheaval of a move. The current data showed that non-movers were higher in the 30-to-44 and 65-plus age groups. Yet, those same numbers revealed that even in the younger-adult population, the moving rate declined.
Again, a look at Census Bureau data may shed some light on the reasons people move – or stay put, as the case may be. According to the Current Population Survey, 40% of people move because they’d like to own rather than rent, would like to live in a better neighborhood, or would like more space or a nicer home. With the hot housing market experiencing soaring house prices during and coming out of the pandemic, these outcomes may now be harder to achieve.
While there are other factors at play – a decline in marriage and birth rates, for example, which are both life events that spur a move – it’s likely that the most significant catalysts to staying put are rising interest rates and Washington’s rising home prices.
As we march steadily into the cooler winter months, the expected seasonal slowdown is upon us. Interest rate increases have continued to influence a quieter-than-usual fall market. Higher mortgage rates reduce buying power, as well as the momentum of move-up buyers and sellers. Fewer sellers mean lower inventory and a reduction in closed sales.
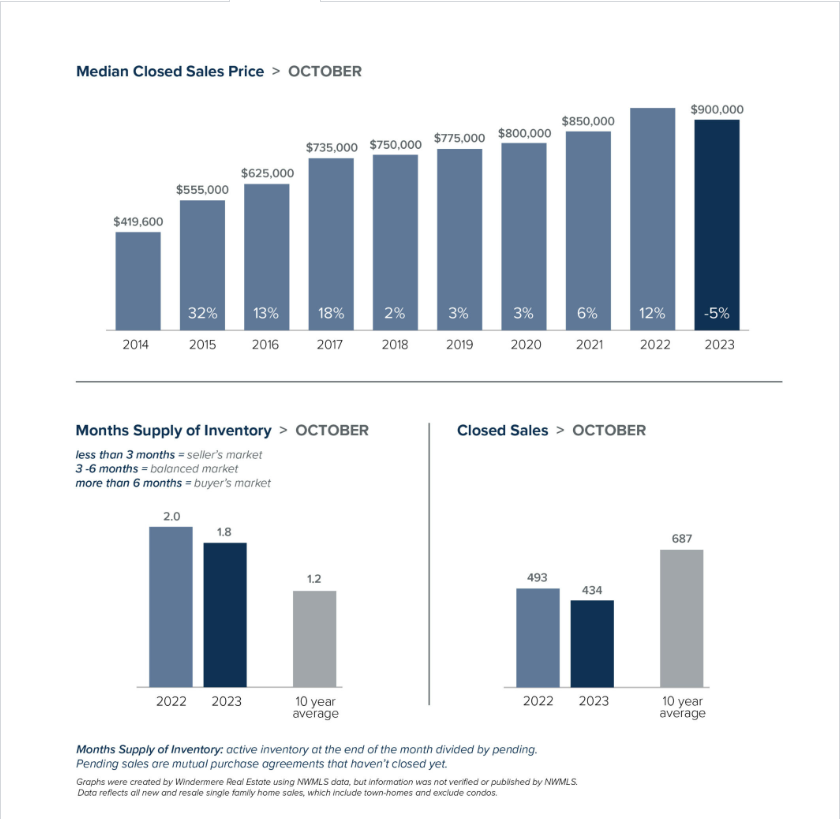
Indeed, the supply of listed homes in our region has continued to decline. As compared to the same month last year, October experienced a 30% decrease in active King County property listings.
If trends hold true to the past three years, the start of winter will bring rising home prices locally. It is expected that median sold prices will rise between December and April, unless rates increase significantly.
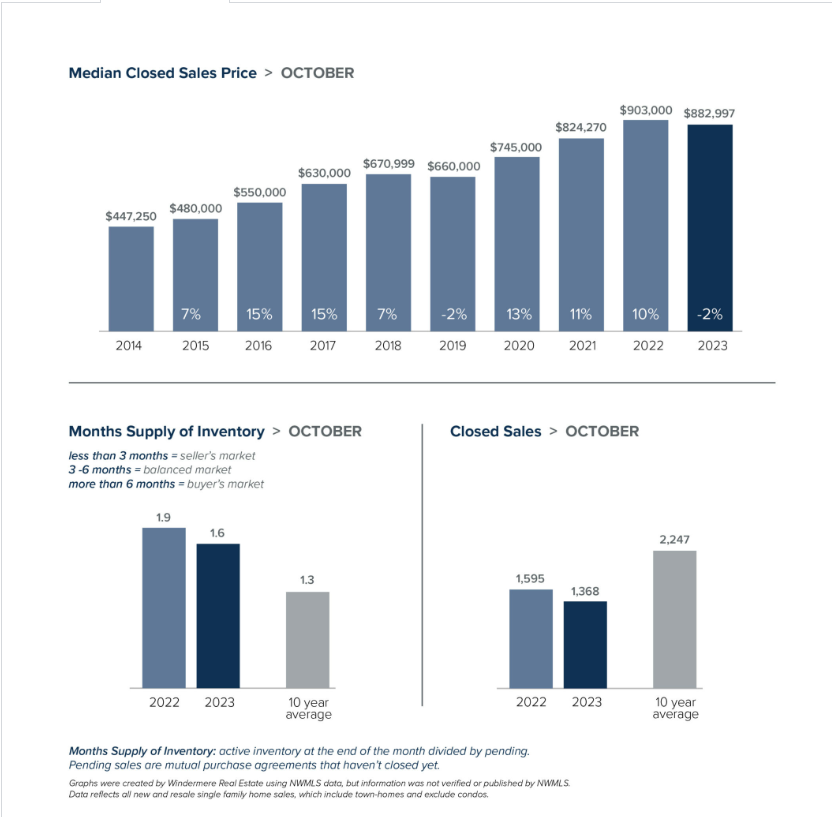
In King County, the median price for single-family homes dropped 2% from $903,000 in October 2022 to $882,997 last month. This was a slight bump up from September, and a 14% increase year-over-year. Despite the expected seasonal lull, 33% of homes are selling above list price in an average of just 6 days. This demonstrates a willingness for buyers to compete for the most desirable properties. Condo prices rose 9% year-over-year to $540,000, versus $494,975.
Following modest price gains from August to September, the Seattle residential market saw a 5% decrease in the median sold price for single-family homes between September and October, from $926,000 to $900,000. Inventory dropped slightly, spurring an increase in the number of homes selling over list price by 5% compared to September. Homes sold, on average, in 6 days. Sold condo prices were 10% higher year-over-year, rising from $522,500 in October 2022 to $573,750 last month. By the end of October, Seattle condo inventory was at 3.6 months’ supply, double the amount for single-family homes.
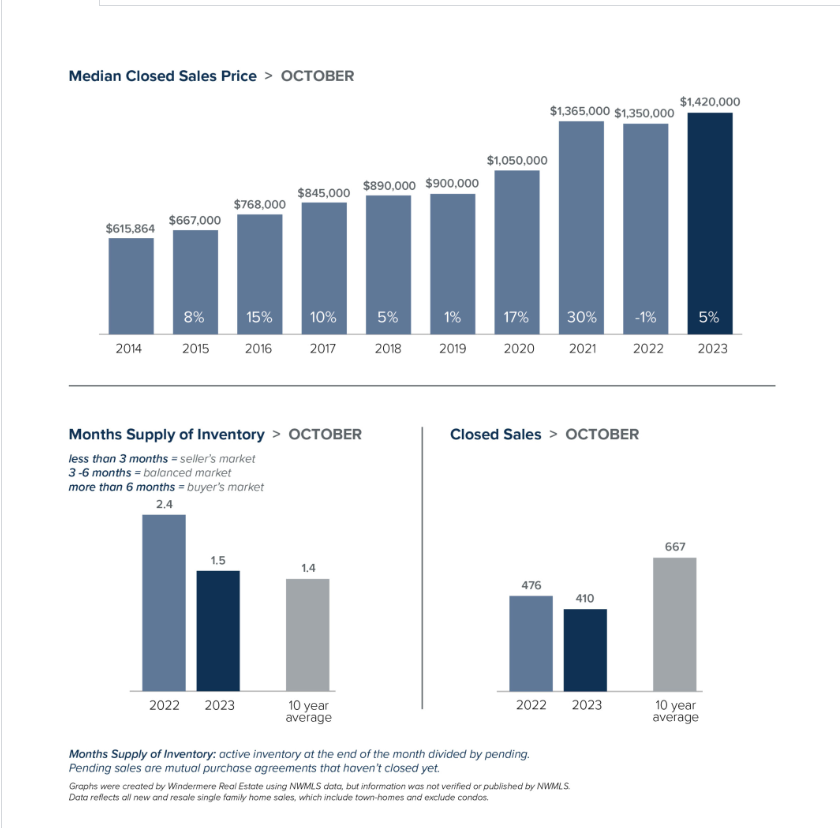
On the Eastside, median sold prices dropped slightly from $1,427,500 in September to $1,420,000 last month, though demand remained high. The portion of homes selling above list price increased to 34% in October, which is more than double the percentage selling over list price at the same time last year. There was also a notable year-over-year difference in months of inventory: 1.5 last month, versus 2.4 in October 2022. Condos on the Eastside sold for about 8% more year-over-year, increasing from a median sold price of $607,500 last year to $657,000 last month.
The October median sold price of a Snohomish County single-family home remained flat year-over-year, at $729,950. Homes selling above list price dropped from 31% in September to 26% last month, the only region covered here with a drop in this metric. That’s still a large increase from October 2022, when 13% of closed sales were over list price. Residential inventory dropped by 38% from October 2022, while the number of listed Snohomish County condos dropped by 23% year-over-year.
The early part of the calendar year typically sees an increase in multiple offers, driven by sellers listing properties in the spring and by a seasonal influx of motivated buyers. With the new year on the horizon and an expected increase in both inventory and buyer activity, now’s the perfect time to chat with your Windermere broker about how to navigate the current market to match your goals.
For any family looking forward to multigenerational living, there’s much to consider when trying to find the right property. Whether you’re planning to welcome your parents or grandparents, provide a comfortable space for adult children, or simply want to create a home that accommodates your extended family, finding the right place takes time. Let’s take a look at some of the key factors that play a role in your home search.
Multigenerational Home Buying
Prioritize Location
Just as with any real estate purchase, location is vital to finding the right home for your extended family. For your young ones, you might consider the nearby schools. For the older folks in your home, you’ll want to know your proximity to healthcare facilities and community spaces. And for everyone under your roof, you’ll want to be close to the places that help you all enjoy life, such as parks, bodies of water, and other recreational areas.
With more people living in a multigenerational home, layout can often take precedence over aesthetics. Of course, you still want your next home to look the part, but fundamentally, you have a lot of foot traffic to account for and future accessibility to think about. Homes with separate living spaces are a great option for accommodating a large family. Features like a furnished basement, a mother-in-law suite, an accessory dwelling unit (ADU), or a detached guesthouse can solve a lot of problems, present and future.
Private Spaces
Along with an ideal layout, it’s important to have private spaces so each person can enjoy their time at home. Make sure there are separate bedrooms, bathrooms, and if possible, separate living areas to allow family members to make the most of their personal space while still enjoying the benefits of living together. You can either look for homes that have defined private spaces or identify the ones that are good candidates for remodeling projects that can create them.
A thorough home inspection is a necessity. With several people living with you—some of whom may be elderly—you need to know that your home can provide for everyone for years to come. The home inspection will help you to identify any potential issues with the property and make informed decisions about how to negotiate with the seller.
When looking for properties, look at the condition of the roof, plumbing, electrical systems, and identify any potential structural concerns. Talk to your agent about the findings of the home inspection and what it means for you as you prepare to make an offer.
How will your needs change at home in the future? Thinking about the long term can help you narrow your home search. Maybe you’ll need additional space as your children grow up or as your parents age into their elderly years.
A home with a more flexible design and layout may be a better investment for you in the long term.
For more information on finding the right home, connect with a local, experienced Windermere agent today:
A stormy night with the lights out can complicate things at home. But with the right preparation, you and your household can switch gears quickly and ride out the blackout period, however long it may last. Power outages can happen unexpectedly, so taking the necessary steps to have a plan in place should be a priority. We’ll walk through some essential steps to stay safe, calm, and cozy when the lights go out.
Lighting During a Power Outage
The first thing you’ll miss during a power outage is light. Make sure you have flashlights, candles, lanterns, and plenty of batteries readily available. Check your devices to see which size batteries they require and make sure you have all the necessary sizes on hand. LED lanterns are energy-efficient and will stay lit for a long time to provide some illumination during an extended blackout.
Emergency Kit
A well-stocked emergency kit is essential during a power outage. Make sure you have a substantial supply of non-perishable food, bottled water, and an assortment of basic utensils. Along with your emergency kit, keep a first aid kit handy to ensure you’re fully prepared for a blackout-related emergency.
Staying Warm During a Power Outage
Even though the lights in your home are out, that doesn’t mean you have to be uncomfortable as you wait for them to come back on. This is especially important if the power outage occurs during the colder months of the year. Keep plenty of blankets and extra layers of clothing close by to make sure you and your family stay cozy. If you have a portable heater that you plan to use, pay attention to the manufacturer instructions to avoid possible carbon monoxide poisoning.
Home Security
Home safety and security is vital during a power outage. Make sure your home’s security system’s motion-activation is still functioning properly, and if it has a backup system, check that too. Unfortunately, some burglars may see a blackout as an opportunity to take advantage of the low-visibility conditions. Lock your windows and secure the deadbolts on your door so you and your household can wait out the power outage in peace.
Preserve Food
Try to keep your refrigerator and freezer closed as much as possible. Use your perishable food rations in your emergency kit as a first option for a meal during the power outage and stick to other non-perishable food items in your pantry. Hopefully, the power will come back on soon enough and you’ll be able to resume your normal food preparation. But if you’re constantly opening the fridge and freezer while the power’s out, your food will spoil quickly, and you could have quite a mess on your hands. 7 Tips for Cleaning Your Appliances
Staying Entertained
Who says you can’t have fun during a power outage? With all your preparations in place, a blackout presents the chance for you and your household to enjoy some electronic-free activities. Have board games, books, arts and crafts materials, and decks of cards at the ready. If you have kids, plan some fun activities ahead of time that they’ll enjoy.
For more tips on emergency planning at home, visit the Living section of our blog:
The following analysis of select counties of the Western Washington real estate market is provided by Windermere Real Estate Chief Economist Matthew Gardner. We hope that this information may assist you with making better-informed real estate decisions. For further information about the housing market in your area, please don’t hesitate to contact your Windermere Real Estate agent.
Regional Economic Overview
The pace of job growth continues to slow in Western Washington, as the region added only 21,907 new positions over the past 12 months. This represented a growth rate of 1.4%, which was the lowest pace of new jobs added since the pandemic ended.
The regional unemployment rate in August was 5.8%, which was marginally below the 6% rate we saw in the same quarter in 2022. A few smaller counties lost jobs over the past 12 months while King County’s employment levels rose a meager .4%, mainly due to job losses in the technology sector. I’ve said before that I’m not convinced that the U.S. is going to enter a recession; I still stand by that theory. Slowing job growth does not necessarily need to be a precursor to a recession, but I expect that we will see lackluster growth until next spring at the earliest.
Western Washington Home Sales
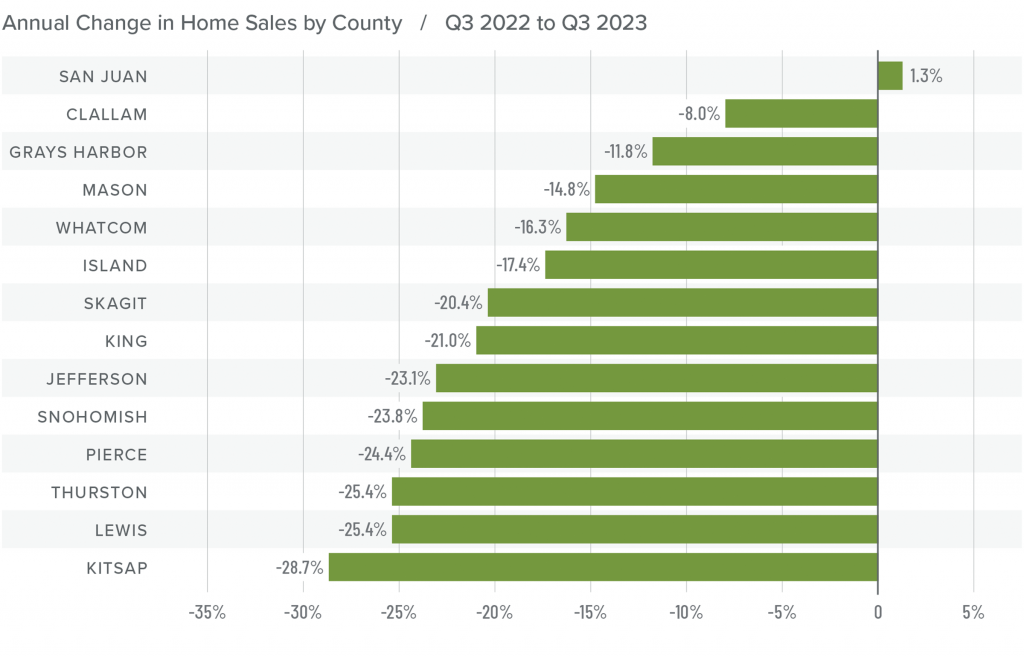
❱ In the third quarter of 2023, 14,970 homes sold. This was down 22% from the third quarter of 2022 and 1% lower than in the second quarter of this year.
❱ Sales fell even as the average number of homes for sale increased 29.5% from the second quarter. This is clearly a sign that significantly higher mortgage rates are having an impact on the market.
❱ Sales fell in all counties except San Juan compared to the third quarter of 2022. They were up in 9 of the 14 counties covered in this report compared to the second quarter of 2023. San Juan, Mason, Grays Harbor, and Whatcom counties saw significant increases.
❱ Pending sales fell 6% compared to the second quarter of this year, suggesting that closings in the upcoming quarter may be lackluster unless mortgage rates fall, which I think is highly unlikely.
Western Washington Home Prices
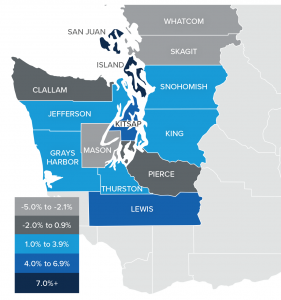
❱ Prices rose 2.8% compared to the third quarter of 2022 and were .6% higher than in the second quarter of this year. The average home sale price was $776,205.
❱ Compared to the second quarter of this year, sale prices were higher in all counties except Grays Harbor (-.5%), Kitsap (-1.5%), Clallam (-1.6%), Whatcom (-2.6%), and Skagit (-3%).
❱ Compared to the prior year, the pace of price growth slowed in the third quarter. This wasn’t too surprising given that the market was coming off record high
prices in the summer of 2022. But what was surprising was that prices rose over the previous quarter despite the fact that mortgage rates were above 7% for almost the entire quarter.
❱ I don’t expect prices to move far from current levels in the coming months, and they likely won’t rise again until mortgage rates start to fall. When prices do rise, I anticipate that the pace of growth will be far more modest than we have become accustomed to.\
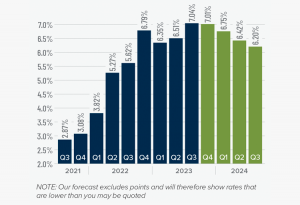
Mortgage Rates
Mortgage rates continued trending higher in the third quarter of 2023 and are now at levels we have not seen since the fall of 2000. Mortgage rates are tied to the interest rate (yield) on 10-year treasuries, and they move in the opposite direction of the economy. Unfortunately for mortgage rates, the economy remains relatively buoyant, and though inflation is down significantly from its high, it is still elevated. These major factors and many minor ones are pushing Treasury yields higher, which is pushing mortgage rates up. Given the current position of the Federal Reserve, which intends to keep rates “higher for longer,” it is unlikely that home buyers will get much reprieve when it comes to borrowing costs any time soon.
With such a persistently positive economy, I have had to revise my forecast yet again. I now believe rates will hold at current levels before starting to trend down in the spring of next year.
Western Washington Days on Market
❱ It took an average of 32 days for homes to sell in the third quarter of 2023. This was 8 more days than in the same quarter of 2022, but 3 fewer days compared to the second quarter of this year.
❱ Snohomish and King counties were the tightest markets in Western Washington, with homes taking an average of only 19 days to find a buyer. Homes for sale in San Juan County took the longest time to find a buyer (57 days).
❱ All counties except Snohomish saw average days on market rise from the same period in 2022. Market time fell in 9 of the 14 counties compared to the prior quarter.
❱ The greatest fall in market time compared to the second quarter was in San Juan County, where market time fell 23 days.
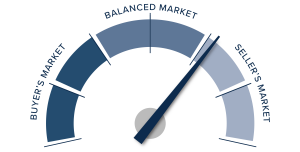
Conclusions
This speedometer reflects the state of the region’s real estate market using housing inventory, price gains, home sales, interest rates, and larger economic factors.
Although it was good that listing activity rose in the third quarter, it still remains well below levels that can be considered normal. This is unlikely to change anytime soon given that over 86% of Washington homeowners with mortgages have an interest rate below 5% and more than a quarter have rates at or below 3%. There is little incentive for them to sell if they don’t have to.
More germane to me is the disconnect between what homeowners believe their homes are worth and what buyers can afford with mortgage rates in the mid-7% range. Most sellers appear to be getting their asking prices, or very close to it, which reflects their confidence in the market. However, home buyers are being squeezed by multi-decade high borrowing costs.
It is all quite a quandary. However, taking all the factors into consideration, sellers still have the upper hand but not enough to move the needle from the position I put it in last quarter.
Given all the factors discussed above, I have decided to leave the needle in the same position as the last quarter. The market still heavily favors sellers, but if rates rise much further, headwinds will likely increase.
About Matthew Gardner
As Chief Economist for Windermere Real Estate, Matthew Gardner is responsible for analyzing and interpreting economic data and its impact on the real estate market on both a local and national level. Matthew has over 30 years of professional experience both in the U.S. and U.K.
In addition to his day-to-day responsibilities, Matthew sits on the Washington State Governors Council of Economic Advisors; chairs the Board of Trustees at the Washington Center for Real Estate Research at the University of Washington; and is an Advisory Board Member at the Runstad Center for Real Estate Studies at the University of Washington where he also lectures in real estate economics.

 Facebook
 X
X
 Pinterest
 Copy Link


 7020 Seward Park Avenue S
  18606 48th Place South


 Western Washington Home Prices
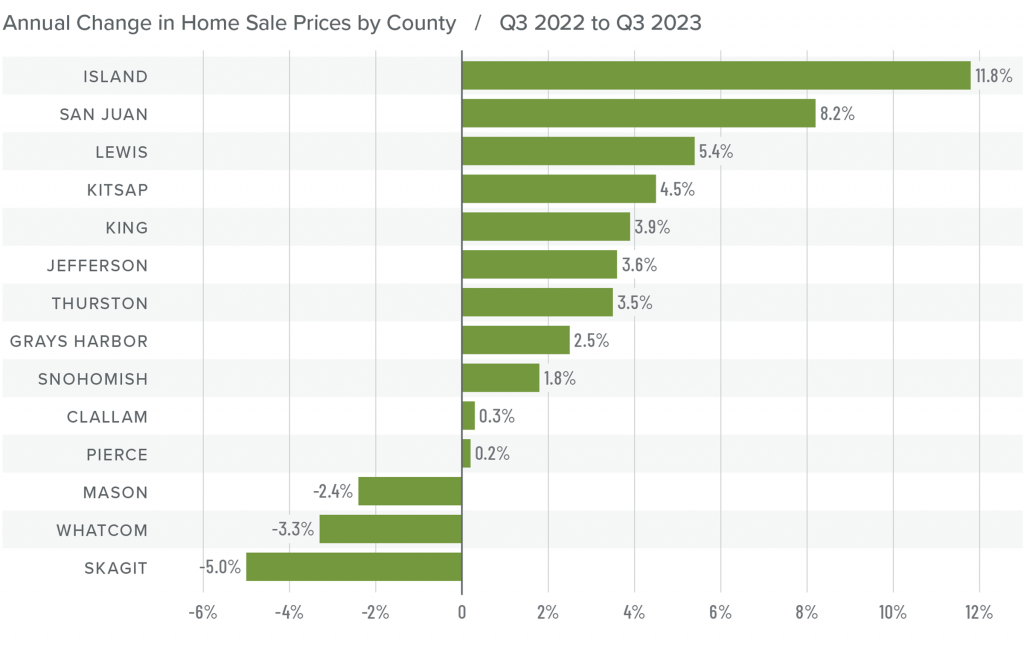
 Mortgage Rates
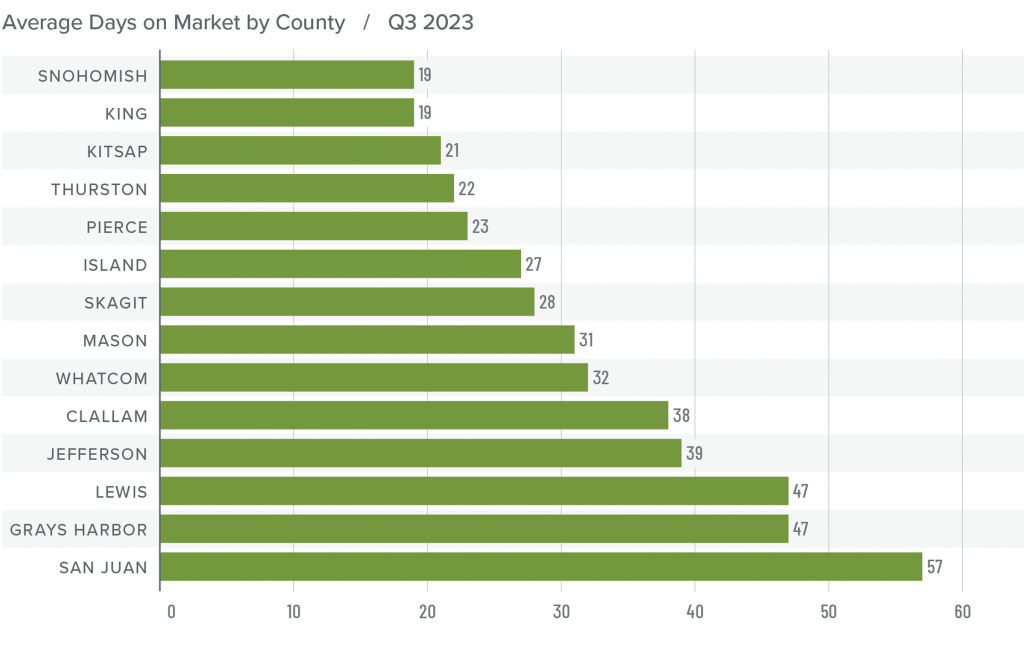
 As Chief Economist for Windermere Real Estate, Matthew Gardner is responsible for analyzing and interpreting economic data and its impact on the real estate market on both a local and national level. Matthew has over 30 years of professional experience both in the U.S. and U.K.